Holocén


Holocén je současné geologické období, druhá a poslední epocha (oddělení) kvartéru známá proto také jako mladší čtvrtohory. Představuje nejmladší geologické období, které začalo s koncem poslední doby ledové přibližně 11 700 let před současností[1] (tedy kolem roku 9700 př. n. l.) a stále trvá.
Holocénu přecházel pleistocén, jehož poslední období se nazývá mladší dryas. Konec doby ledové charakterizovaly rozsáhlé klimatické změny – postupné oteplování.[2] Před 10 000 lety tak bylo například v Kanadě tepleji než nyní.[3] To umožnilo přechod (neolitická revoluce) lidstva od sběračství a lovectví k pastevectví a zemědělství, a tím vytvořilo podmínky pro vznik prvních civilizací. Lesy se rozšířily více na sever.[4] Jsou různé hypotézy o příčinách změn v mladším dryasu. Roku 2018 byl v Grónsku objeven velký kráter z doby před 12 tisíci lety[5][6] a roku 2020 v Sýrii jeden z mnoha předpokládaných fragmentů dopadu.[7] Hypotéza impaktu v mladším dryasu se zdá pravděpodobná.[8][9] Ovšem přechod začal již dříve a byl složitější.[10] Roli hrál i vulkanismus.[11]
Toto období se někdy označuje také jako doba poledová (postglaciál). S vědomím skutečnosti, že doby ledové se opakují (trvají cca 100 000 let) a jsou střídány kratšími dobami meziledovými, je holocén pravděpodobně nejnovější dobou meziledovou.
Na počátku holocénu vyhynulo mnoho druhů velkých savců (například šavlozubí tygři a mamuti). Ve středním holocénu populační dynamiku určovaly společenské faktory (jako násilí) a nikoli klima.[12]
Členění
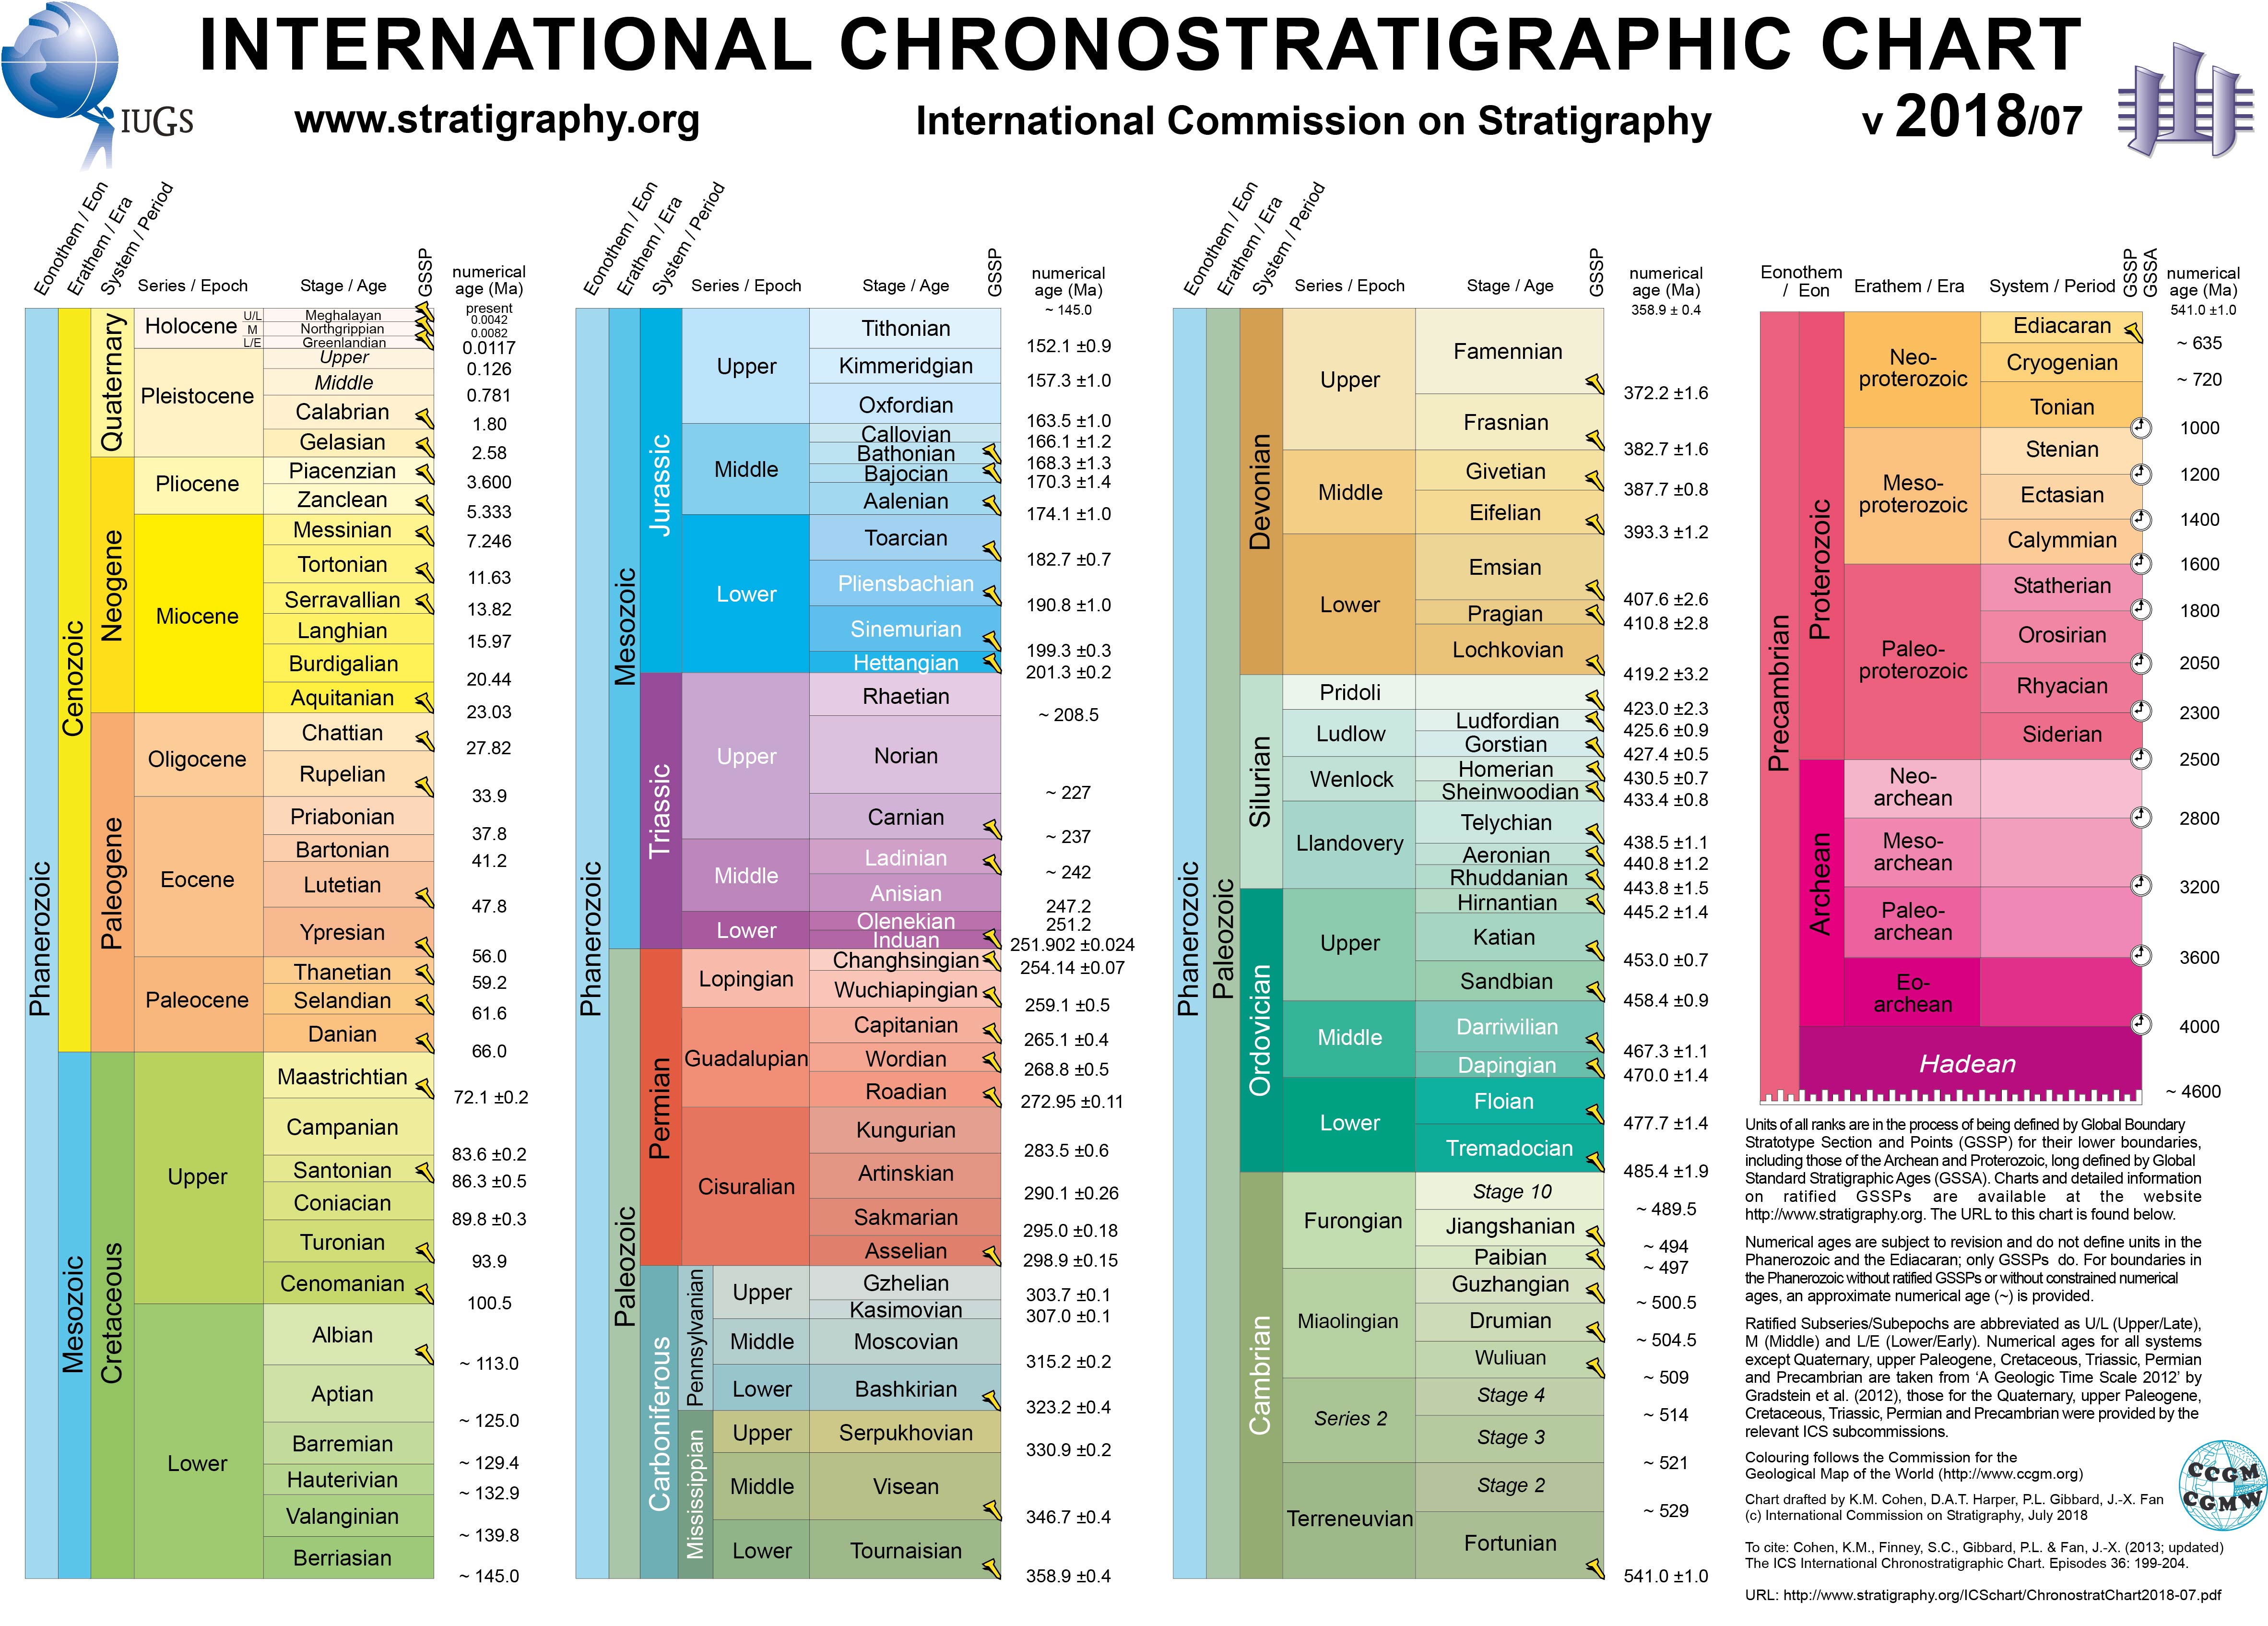
Holocén se dělí na 3 pododdělení: raný (spodní), střední a pozdní (svrchní) holocén.[13] Ta odpovídají stupňům greenland, northgrip a meghalay, které zavedla Mezinárodní komise pro stratigrafii v roce 2018.[14] Toto členění je ale kritizováno.[15]
| epocha / oddělení | pododdělení[14][1] | věk / stupeň[1] | počátek[16]v rocích B2k[pozn. 1] | délka trvání v rocích |
|---|---|---|---|---|
| holocén | svrchní / pozdní | meghalay | 4250 | 4274 |
| střední | northgrip | 8326 | 4076 | |
| spodní / raný | greenland | 11 700 | 3374 |
Na základě změn klimatu v Evropě a Severní Americe se holocén na severní polokouli dělil do pěti období či chronozón:
- Preboreál (10–9 tisíc let před dneškem – B. P.),
- Boreál (9–8 tisíc let),
- Atlantik (8–5 tisíc let),
- Subboreál (5–2,5 tisíc let) a
- Subatlantik (2500–současnost).[17]
V současnosti je některými vědci prosazováno ještě kratší a mladší geologické období, antropocén, které by bylo definováno jako období, kdy začalo mít lidstvo globální vliv na Zemi. To by bylo mladší částí dnešního holocénu.[18]
Odkazy
Poznámky
- ↑ Počátek jednotky, resp. stáří její báze (dolní hranice), se uvádí v miliónech let před dneškem (přesněji před rokem 2000). Data jsou nepřesná s odchylkou až několik procent. To je způsobeno převážně nejistotou použitého měření.
Reference
- ↑ a b c INTERNATIONAL CHRONOSTRATIGRAPHIC CHART v 2018/07 [online]. International Commission on Stratigraphy [cit. 2018-10-01]. Dostupné online.
- ↑ Revised Holocene temperature record affirms role of greenhouse gases in recent millennia. phys.org [online]. 2021-01-27 [cit. 2021-11-04]. Dostupné online. (anglicky)
- ↑ YIRKA, Bob. Canadian ice core samples show Holocene temperatures were higher than today. phys.org [online]. 2017-05-17 [cit. 2021-11-04]. Dostupné online. (anglicky)
- ↑ Changes Since the Last Ice Age [online]. earthobservatory.nasa.gov, 2002-08-20 [cit. 2021-11-04]. Dostupné online. (anglicky)
- ↑ Huge crater discovered in Greenland from impact that rocked Northern Hemisphere. phys.org [online]. 2018-11-14 [cit. 2021-11-04]. Dostupné online. (anglicky)
- ↑ FERN, Sonia. Geologic evidence supports theory that major cosmic impact event occurred approximately 12,800 years ago. phys.org [online]. 2019-03-13 [cit. 2021-11-04]. Dostupné online. (anglicky)
- ↑ FERN, Sonia. Researchers find evidence of a cosmic impact that caused destruction of one of the world's earliest human settlements. phys.org [online]. 2020-03-07 [cit. 2021-11-04]. Dostupné online. (anglicky)
- ↑ SWEATMAN, Martin B. The Younger Dryas impact hypothesis: Review of the impact evidence. S. 103677. Earth-Science Reviews [online]. 2021-07. Roč. 218, s. 103677. Dostupné online. DOI 10.1016/j.earscirev.2021.103677. (anglicky)
- ↑ A prehistoric cosmic airburst preceded the advent of agriculture in the Levant. phys.org [online]. [cit. 2023-10-04]. Dostupné online.
- ↑ CLARK, P. U.; SHAKUN, J. D.; BAKER, P. A.; BARTLEIN, P. J.; BREWER, S.; BROOK, E.; CARLSON, A. E. Global climate evolution during the last deglaciation. S. E1134–E1142. Proceedings of the National Academy of Sciences [online]. 2012-05-08 [cit. 2019-03-14]. Roč. 109, čís. 19, s. E1134–E1142. Dostupné v archivu pořízeném dne 2019-06-19. DOI 10.1073/pnas.1116619109. (anglicky)
- ↑ Texas cave sediment upends meteorite explanation for global cooling. phys.org [online]. 2020-07-31 [cit. 2021-11-04]. Dostupné online. (anglicky)
- ↑ Study suggests warfare was responsible for the boom-bust cycles of Neolithic societies. phys.org [online]. [cit. 2023-06-19]. Dostupné online.
- ↑ WALKER, M. J. C.; BERKELHAMMER, M.; BJÖRCK, S.; CWYNAR, L. C.; FISHER, D. A.; LONG, A. J.; LOWE, J. J. Formal subdivision of the Holocene Series/Epoch: a Discussion Paper by a Working Group of INTIMATE (Integration of ice-core, marine and terrestrial records) and the Subcommission on Quaternary Stratigraphy (International Commission on Stratigraphy). S. 649–659. Journal of Quaternary Science [online]. 2012-10. Roč. 27, čís. 7, s. 649–659. Dostupné online. DOI 10.1002/jqs.2565. (anglicky)
- ↑ a b http://www.stratigraphy.org/index.php/ics-news-and-meetings/120-ics-chart-containing-the-quaternary-gssps-and-new-stages-v-2018-07-is-now-released - ICS chart containing the Quaternary and Cambrian GSSPs and new stages (v 2018/07) is now released!
- ↑ YIRKA, Bob. Historian angers group who proposed labeling late Holocene as Meghalayan Age. phys.org [online]. 2018-09-21 [cit. 2021-11-04]. Dostupné online. (anglicky)
- ↑ ASCH, Kristine; KÖSTERKE, Susanna; MARKER, Brian. International Commission on Stratigraphy: New Subdivisions of the Holocene. S. 1–2. IUGS E-Bulletin [online]. International Union of Geological Sciences, červen 2018 [cit. 2018-10-01]. Čís. 43, s. 1–2. Dostupné v archivu pořízeném dne 2018-07-16. PDF [1]. (anglicky)
- ↑ MANGERUD, Jan; ANDERSON, Svend T.; BERGLUND, Bjorn E.; DONNER, Joakim J. Quaternary stratigraphy of Norden: a proposal for terminology and classification. Boreas. October 1, 1974, s. 109–128. Dostupné online. DOI 10.1111/j.1502-3885.1974.tb00669.x. (anglicky)
- ↑ Věk člověka. Respekt. 2011, roč. XXII, čís. 38/39, s. 60–66. Přeloženo z The Economist. Dostupné online. ISSN 0862-6545.
Související články
Externí odkazy
 Obrázky, zvuky či videa k tématu holocén na Wikimedia Commons
Média použitá na této stránce
Temperature changes (determined as proxy temperatures) taken from the central areas of Greenland's ice sheet during Late Pleistocene and Beginning of Holocene.
Autor: RCraig09, Licence: CC BY-SA 4.0
Graph of temperature anomaly from 20,000 years ago through 10,000 years ago, a time period encompassing recovery from the most recent ice age. Data is from EPICA Dome C Ice Core.
Source of raw dataset & archive thereof (>5,800 rows):
- https://www1.ncdc.noaa.gov/pub/data/paleo/icecore/antarctica/epica_domec/edc3deuttemp2007.txt
- https://web.archive.org/web/20191014051524/https://www1.ncdc.noaa.gov/pub/data/paleo/icecore/antarctica/epica_domec/edc3deuttemp2007.txt
Chart is described in NASA "Earth observatory" webpage:
- https://earthobservatory.nasa.gov/features/GlobalWarming/page3.php
- https://web.archive.org/web/20190924011459/https://earthobservatory.nasa.gov/features/GlobalWarming/page3.php
Source document suggests the following citation:
- Jouzel, J., et al. 2007. EPICA Dome C Ice Core 800KYr Deuterium Data and Temperature Estimates. IGBP PAGES/World Data Center for Paleoclimatology Data Contribution Series # 2007-091. NOAA/NCDC Paleoclimatology Program, Boulder CO, USA.
- Jouzel, J., V. Masson-Delmotte, O. Cattani, G. Dreyfus, S. Falourd, G. Hoffmann, B. Minster, J. Nouet, J.M. Barnola, J. Chappellaz, H. Fischer, J.C. Gallet, S. Johnsen, M. Leuenberger, L. Loulergue, D. Luethi, H. Oerter, F. Parrenin, G. Raisbeck, D. Raynaud, A. Schilt, J. Schwander, E. Selmo, R. Souchez, R. Spahni, B. Stauffer, J.P. Steffensen, B. Stenni, T.F. Stocker, J.L. Tison, M. Werner, and E.W. Wolff. 2007. Orbital and Millennial Antarctic Climate Variability over the Past 800,000 Years. Science, Vol. 317, No. 5839, pp.793-797, 10 August 2007.
- ABSTRACT: A high-resolution deuterium profile is now available along the entire European Project for Ice Coring in Antarctica Dome C ice core, extending this climate record back to marine isotope stage 20.2, ~800,000 years ago. Experiments performed with an atmospheric general circulation model including water isotopes support its temperature interpretation. We assessed the general correspondence between Dansgaard-Oeschger events and their smoothed Antarctic counterparts for this Dome C record, which reveals the presence of such features with similar amplitudes during previous glacial periods. We suggest that the interplay between obliquity and precession accounts for the variable intensity of interglacial periods in ice core records.
- GEOGRAPHIC REGION: Antarctica
- PERIOD OF RECORD: 803 KYrBP - present
- DESCRIPTION: High-resolution (55cm.) deuterium (dDice) profile from the EPICA Dome C Ice Core, Antarctica (75� 06' S, 123� 21' E), with an optimal accuracy of � 0.5 � (1 sigma), from the surface down to 3259.7 m.
- DATA: EPICA Dome C bag deuterium data (LSCE, analytical accuracy of 0.5 per mille)
- Temperature estimated after correction for sea-water isotopic composition (Bintanja et al, 2005) and for ice sheet elevation (Parrenin et al, 2007) on EDC3 age scale (Parrenin et al, 2007)
Uploader notes:
To graph this data (and to meet Microsoft Excel's need for regularly-spaced x-axis values), uploader RCraig09 took data ranging from 10,000 to 20,000 years ago, and mapped each datapoint to the nearest 20-year interval. This mapping expanded 348 (approx) raw temperature data points to 500 regular time intervals, with each resulting time therefore being within 10 years of the original raw datapoint (10/10,000 yields graphing precision to within 0.1%). The resulting temperature data series actually used to make this graph, and their five-interval (100-year) moving average data series, are provided in the expandable text below.
Two views of the Hiawatha crater region: one covered by the Greenland Ice Sheet, the other showing the topography of the rock beneath the ice sheet, including the crater.