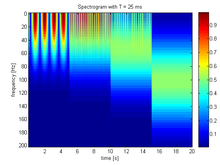
Krátkodobá Fourierova transformace
Jako krátkodobá Fourierova transformace (short-time Fourier transform, STFT) se označuje Fourierova transformace aplikovaná na analyzovanou funkci postupně po krátkých úsecích, které vybírá pomocí reálného symetrického okna. Tím řeší problém souběžného určení času i frekvence, na kterých je rozmístěna energie signálu (funkce). Tato transformace tedy provádí časově-frekvenční analýzu.
STFT analyzuje signál po krátkých úsecích, které vybírá pomocí jeho součinu s reálným symetrickým oknem . Jádro transformace tvoří
- .
Dopředná transformace je definována jako
- .
Pro určení energie se používá tzv. spektrogram
- .
Speciálním případem STFT je Gaborova transformace, která používá okno ve tvaru Gaussovy funkce
- .
Z definice je zřejmé, že změna rozlišení ve frekvencích vyžaduje přepočítání celé transformace s jinou velikostí okna. Tento problém se snaží odstranit vlnková transformace.
Externí odkazy
 Obrázky, zvuky či videa k tématu Krátkodobá Fourierova transformace na Wikimedia Commons
Média použitá na této stránce
Autor: Alessio Damato, Licence: CC BY-SA 3.0
This picture is one of the four spectrograms I have created of the following signal:
sampled at 400 Hz. I have created this picture and all the other three spectrograms with the following Matlab code, that is based on my stft script that you can find at User:Alejo2083/Stft script:
clear all;

%sampling frequency
fc=400;
%duration of the signal
T=20;
%zero padding factor
my_zero=10;

%generate the signal
t=linspace(0,T,fc*T);
x=zeros(1,length(t));
%thresholds
th1=0.25*T*fc;
th2=0.5*T*fc;
th3=0.75*T*fc;
th4=T*fc;
x(1:th1)=cos(2*pi*10*t(1:th1));
x((th1+1):th2)=cos(2*pi*25*t((th1+1):th2));
x((th2+1):th3)=cos(2*pi*50*t((th2+1):th3));
x((th3+1):th4)=cos(2*pi*100*t((th3+1):th4));

%calculate and show the spectrograms
[spectrogram, axisf, axist]=stft(x,10,1,fc,'blackman',my_zero);
spectrogram=spectrogram/max(spectrogram(:));
figure,imagesc(axist,axisf,spectrogram),
title('Spectrogram with T = 25 ms'),
ylabel('frequency [Hz]'),
xlabel('time [s]'),
colorbar;

[spectrogram, axisf, axist]=stft(x,50,1,fc,'blackman',my_zero);
spectrogram=spectrogram/max(spectrogram(:));
figure,imagesc(axist,axisf,spectrogram),
title('Spectrogram with T = 125 ms'),
ylabel('frequency [Hz]'),
xlabel('time [s]'),
colorbar;

[spectrogram, axisf, axist]=stft(x,150,1,fc,'blackman',my_zero);
spectrogram=spectrogram/max(spectrogram(:));
figure,imagesc(axist,axisf,spectrogram),
title('Spectrogram with T = 375 ms'),
ylabel('frequency [Hz]'),
xlabel('time [s]'),
colorbar;

[spectrogram, axisf, axist]=stft(x,400,1,fc,'blackman',my_zero);
spectrogram=spectrogram/max(spectrogram(:));
figure,imagesc(axist,axisf,spectrogram),
title('Spectrogram with T = 1000 ms'),
ylabel('frequency [Hz]'),
xlabel('time [s]'),
colorbar;


