Mapa světa


Mapa světa je mapa většiny nebo celého povrchu Země. Mapy světa tvoří zvláštní kategorii map vzhledem k problému projekce. Rovinné mapy nutně zkreslují prezentaci zakřiveného zemského povrchu. Tyto deformace jsou na mapě světa největší. Různé druhy projekcí povrchu země odrážejí různé technické a estetické požadavky na mapy světa.[2]
Mapy světa jsou také odlišné tím, že pro jejich vytváření je potřeba mít globální znalosti povrchu Země. Smysluplné mapy světa nebylo možno vytvořit před začátkem renesance, protože žádné kultuře nebylo známo víc než polovina pobřeží oceánů, natož nitra kontinentů. Nové poznatky o zemském povrchu se od té doby hromadí a jejich získávání pokračuje dodnes.
Mapy světa se obecně zaměřují buď na politické, nebo na fyzikální rysy zemského povrchu. Politické mapy zdůrazňují územní hranice a lidské osídlení. Fyzické mapy ukazují geografické rysy, jako jsou hory, typy půdy nebo využití půdy. Geologické mapy ukazují nejen povrchy, ale i vlastnosti podloží, zlomy a podpovrchové struktury. Mapy mohou používat barevný odstín a intenzitu barvy pro znázornění rozdílů mezi regiony, např. mohou vyznačovat demografické nebo ekonomické statistiky.
Zobrazení
Mapa je vyrobena pomocí kartografického zobrazení čili projekce, což je metoda promítnutí povrchu zeměkoule na plochu. Všechna zobrazení zkreslují vzdálenosti a směry, přičemž každé má jiná zkreslení. Snad nejznámější zobrazení je Mercatorovo, původně navržené pro námořní mapy.
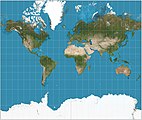 Mercatorovo zobrazení (82°j. š. a 82°s. š.)
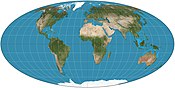
 B. J. S. Cahill: Motýlí mapa, 1909, podle letáku z roku 1919
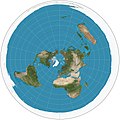 Polární azimutální ekvidistantní projekce
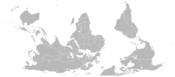 Mapa orientovaná jihem vzhůru
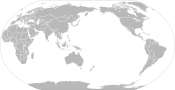 Mapa centrovaná na Tichý oceán (často používaná ve Východní Asii a Oceánii)
 Gallovo–Petersovo zobrazení zachovává plochy
 Robinsonovo zobrazení, které používala National Geographic Society


Tematické mapy
Tematická mapa ukazuje geografické informace o jednom nebo několika konkrétních jevech. Tyto mapy mohou líčit fyzické, sociální, politické, kulturní, ekonomické, sociologické, zemědělské nebo jiné aspekty města, státu, regionu, národa či kontinentu.[3]
 Mapa klimatických pásů
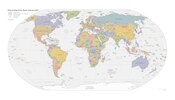 Jednoduchá politická mapa světa
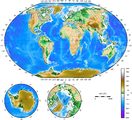 Topographická mapa světa
 Mapa antropogenních emisí CO2 podle zemí
 Index lidského rozvoje zemí k roku 2016
 Střední délka života
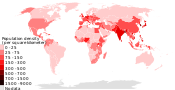 Hustota osídlení (2018)
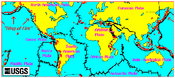 Sopečná činnost
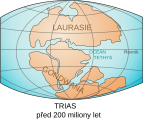 Kontinenty před 200 milióny let (trias)
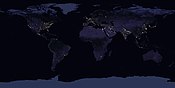 Satelitní fotografie noční Země


Historické mapy
Rané mapy světa byly vytvářeny od doby železné až do věku zámořských objevů a vzniku moderní geografie v průběhu raného novověku. Staré mapy poskytují mnoho informací o tom, co bylo známo v dobách minulých, stejně jako o filozofii a kulturním základu map, které byly často značně odlišné od moderní kartografie. Mapy jsou jedním z prostředků, kterými vědci šíří své myšlenky a předávají je budoucím generacím.[4]
 Hypotetická rekonstrukce Anaximandrovy mapy světa (610-546 př. n. l.)
 Mapa světa podle Poseidónia (150-130 př. n. l.), nakreslená v roce 1628.
 Ideální rekonstrukce středověké T-mapy (Meyers Konversationslexikon, 1895); Asie zobrazena na pravé straně
 Tabula Rogeriana, mapa světa podle Muhammada al-Idrisiho v roce 1154. Všimněte si, že sever je dole.
 Mapa světa v oktantovém zobrazení (Leonardo da Vinci, 1514).
 Mapa světa podle Gerharda Mercatora (1569), první mapa v Mercatorově zobrazení.
 Mapa světa podle Claese Janszoona Visschera (1652)
 Historická mapa světa, Gerard van Schagenem (1689)

Reference
V tomto článku byl použit překlad textu z článku World map na anglické Wikipedii.
- ↑ Large-Scale Distortions in Map Projections, 2007, David M. Goldberg & J. Richard Gott III, 2007, V42 N4.
- ↑ American Cartographic Association's Committee on Map Projections. Choosing a World Map. Falls Church: American Congress on Surveying and Mapping, 1988. S. 1–2.
- ↑ Thematic Maps Archivováno 7. 9. 2012 na Wayback Machine. Map Collection & Cartographic Information Services Unit. University Library, University of Washington. Accessed 27 Dec 2009.
- ↑ History of maps and cartography [online]. [cit. 2018-04-29]. Dostupné v archivu pořízeném dne 2011-07-09.
Externí odkazy
 Obrázky, zvuky či videa k tématu Mapa světa na Wikimedia Commons
 - CIA World Factbook, mapy světa Archivováno 10. 2. 2011 na Wayback Machine.
Média použitá na této stránce
A political map of the world centered at the 162E longitude line.
Detailed SVG map with grouping enabled to connect all non-contiguous parts of a country's territory for easy colouring. Smaller countries can also be represented by larger circles to show their data easier.
A thorough description of use and other instructions relating to can be found on the instruction page

Autor: https://commons.wikimedia.org/wiki/User_talk:Happenstance, Licence: CC BY-SA 4.0
Human Development Index Report (Published March 21 2017).

World map according to ideas by Posidonius (150-130 B.C.), drawn by 16th century cartographers Petrus Bertius & Melchior Tavernier in 1628. Many of the details in this map couldn't have been known by Posidonius, rather, Bertius and Tavernier show Posidonius' ideas about the positions of the continents.

Autor: Strebe, Licence: CC BY-SA 3.0
The world on Gall–Peters projection. 15° graticule. Imagery is a derivative of NASA’s Blue Marble summer month composite with oceans lightened to enhance legibility and contrast. Image created with the Geocart map projection software.

Autor: LordToran, Licence: CC BY-SA 3.0
This SVG map shows the macroclimates of the Earth.

Autor: Vinny Burgoo, Licence: CC BY-SA 3.0
Cumulative per capita responsibility for anthropogenic CO2
Data from the World Resources Institute's CAIT 4.0 database (registration required). Includes CO2 emitted up to the year 2000 only (not CH4, N20, PFCs, HFCs or SF6). Estimates of the effects of land-use change are included; bunker-fuel emissions are not. The scale is a 0-100 decay-weighted index.
The land-use estimates include the following (list from the relevant CAIT data note):
- Clearing of natural ecosystems for permanent croplands (cultivation)
- Clearing of natural ecosystems for permanent pastures (no cultivation)
- Abandonment of croplands and pastures with subsequent recovery of carbon stocks to
those of the original ecosystem
- Shifting cultivation (swidden agriculture) (repeated clearing, abandonment, and reclearing
of forests in many tropical regions)
- Wood harvest (industrial wood as well as fuel wood) - it is important to note that these
estimates include the emissions of carbon from wood products (burned, stored in longterm pools, decayed over time)
- For the U.S. only, management of wildfires and woody encroachment
Also from the CAIT data note: "It is also important to note that the calculated flux of carbon does not explicitly include changes in carbon stocks that may result from various forms of management. Examples of what is not included are agricultural intensification, fertilization, the trend to no-till agriculture, thinning of forests, changes in species or varieties, and other silvicultural practices."
And the data note warns that "these estimates of national sources and sinks of carbon from land-use change are uncertain on the order of +/- 150% for large fluxes, and +/- 50 MtC/yr for estimates near zero."
So CAIT's land-use estimates are a bit wild. They are, however, the best currently available at a national level.Ortelius World Map Typvs Orbis Terrarvm, 1570.

World map - Produced in Amsterdam
First edition : 1689. Original size : 48.3 x 56.0 cm. Produced using copper engraving. Extremely rare set of maps, only known in one other example in the Amsterdam University. No copies in American libraries. In original hand color.

South-up map of the world with political borders
The world on Winkel tripel projection. 15° graticule. Imagery is a derivative of NASA’s Blue Marble summer month composite with oceans lightened to enhance legibility and contrast. Image created with the Geocart map projection software.

Složený snímek ukazuje noční pohled na zemský povrch v roce 2016.

Autor: Giorgi Balakhadze, Licence: CC BY-SA 4.0
Population density of countries 2018 world map, people per sq km

Mappamundi (World Map)

Carta do Mundo de Mercator (1569)
.svg)
Possibly what the lost first map of the world by Anaximander looked like.

Autor: User: Panos84 (Panagiotis V. Lazaridis), Licence: CC BY-SA 4.0
Life Expectancy at birth (years)
|
over 80
77.5-80
75-77.5
72.5-75
70-72.5
67.5-70
65-67.5
|
60-65
55-60
50-55
45-50
40-45
under 40
not available
|
Life expectancy at birth (years) world map including:
1) 191 United Nations member states (all except Montenegro)
2) Republic of China - Taiwan
3) Western Sahara territory
4) 27 non-sovereign entities marked with a white hyphen (-) or a black asterisk (*):
- 23 dependent territories
- Hong-Kong and Macau: Special Administrative Regions of the People's Republic of China.
- Occupied Palestinian Territories: West Bank and Gaza Strip.
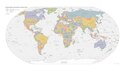
CIA World Factbook Political World Map. January 2015 is the latest vector version available of this file. (The October 2016 PDF contains a bitmap version, not vector. And February 2021 PDF version is partially vector, and partially bitmap.)

Autor: Strebe, Licence: CC BY-SA 3.0
The world on Mollweide projection. 15° graticule. Imagery is a derivative of NASA’s Blue Marble summer month composite with oceans lightened to enhance legibility and contrast. Image created with the Geocart map projection software.

Autor: Strebe, Licence: CC BY-SA 3.0
The world on Mercator projection between 82°S and 82°N. 15° graticule. Imagery is a derivative of NASA’s Blue Marble summer month composite with oceans lightened to enhance legibility and contrast. Image created with the Geocart map projection software.

Autor: Strebe, Licence: CC BY-SA 3.0
The world on azimuthal equidistant projection. 15° graticule, polar aspect. Imagery is a derivative of NASA’s Blue Marble summer month composite with oceans lightened to enhance legibility and contrast. Image created with the Geocart map projection software.

Autor: Strebe, Licence: CC BY-SA 3.0
The world on Robinson projection. 15° graticule. Imagery is a derivative of NASA's Blue Marble summer month composite with oceans lightened to enhance legibility and contrast. Image created with the Geocart map projection software.


Copy of Al Idrisi Tabula Rogeriana with arabic names transliterated into the roman alphabet. The original has north at the bottom, so it appears "upside down". Please do not rotate it to have north at the top, as we seek to preserve the original.

Autor: Podzemnik (talk), Lenny222, Licence: CC BY 3.0
The continents Laurasia-Gondwana 200 million years ago.