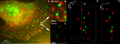
Superrozlišovací mikroskopie
Superrozlišovací mikroskopie je optická mikroskopie umožňující pozorovat objekty s rozlišením vyšším než difrakční limit. Ten při běžné světelné mikroskopii neumožňuje odlišit dva body bližší než přibližně 250 nm[1][2][3][4] Za pokroky ve vývoji těchto metod v roce 2014 získali Eric Betzig, Stefan W. Hell a William E. Moerner Nobelovu cena za chemii.[5]
4Pi mikroskopie
4Pi mikroskop je podobný klasickému konfokálnímu mikroskopu, ale má 2 stejné objektivy, každý na opačné straně vzorku, zaostřené na stejné místo. Obrazy z nich se skládají a ve výsledku tak fungují jako jeden objektiv s dvojnásobku numerickou aperturou, což vede ke zlepšení rozlišení. Díky interferenci proti sobě jdoucích paprsků se ještě více zmenšuje objem, do nějž se promítá bod, zejména v axiálním směru.[6][7] Výsledné laterální rozlišení dosahuje až 100 nm a axilální rozlišení až 190 nm.
Mikroskopie se strukturovaným osvětlením (SIM)

SIM (Structured Illumination Microscopy) využívá osvětlení vzorku světlem s pruhovaným vzorem vzniklým difrakcí na mřížce. Interferencí s detaily vzorku vzniká moiré efekt. Jeho následným počítačovým zpracováním lze spočítat, jak vypadaly struktury, jež ho způsobily, a získat tak obrázek obsahující jemnější detaily s rozlišením okolo 100 nm.[8][9]
Skenovací optická mikroskopie blízkého pole (NSOM)
NSOM (Near-field Scanning Optical Microscopy) zobrazuje vzorky pomocí skenování sondou nanometrových rozměrů, která slouží jako zdroj světla a/nebo detektor fluorescenčního záření. Jako sonda slouží hrot z průhledného materiálu v neprůhledném obalu, který má na konci miniaturní otvor. Otvor je podstatně menší než vlnová délka světla, které tak nemůže projít skrz, v jeho blízkém okolí se však tvoří evanescentní vlna, která dokáže fluorofory excitovat. Její intenzita exponenciálně klesá se vzdáleností, takže oblast, v níž se excitují fluorofory, je menší než difrakční limit, zhruba 100 nm.[10] Nevýhodou této metody je, že z principu dokáže zobrazovat jen povrch vzorku, zároveň ovšem nutně musí sbírat potenciálně zajímavé informace o topologii povrchu.
Vyčerpání stimulovanou emisí (STED)
STED (STimulated Emission Depletion) využívá možnosti vyčerpat energii z fluoroforu stimulovanou emisí. Zároveň s excitačním světlem se fluorofor osvětlí světlem s delší vlnovou délkou, které způsobí, že místo fluorescenčního záření se vyzáří světlo o vlnové délce excitačního záření, které je odfiltrováno. Paprsek laseru s vyšší vlnovou délkou má na průřezu tvar mezikruží, takže ke zhášení fluorescence dochází pouze u okraje oblasti osvícené excitačním laserem. Fluorescenční záření tak vzniká pouze v nezhášené oblasti uvnitř mezikruží, čímž dochází ke zlepšení rozlišení. Rozlišení závisí na tom, jak moc dokážeme omezit oblast, v níž nedochází k vyčerpávání fluorescence.[11] Ta je limitována intenzitou záření laseru s delší vlnovou délkou a u biologických vzorků limituje nejlepší dosažitelné rozlišení, protože při přílišné intenzitě osvětlení dochází k poškozování vzorku. V praxi se maximální rozlišení pohybuje okolo 60 nm.
STORM, PALM a FPALM
Metody STORM (STochastic Optical Reconstruction Microscopy) [12], PALM (PhotoActivation Localization Microscopy) [13] a FPALM (Fluorescence PhotoActivation Localization Microscopy) [14] byly nezávisle publikovány krátce po sobě a využívají stejný princip. Fluorofory pro tyto techniky mají dva stavy, jeden schopný fluorescence a druhý fluorescence neschopný, které se dají přepínat světlem různých vlnových délek nebo se přepínají stochasticky. Ve stavu schopném fluorescence se nachází vždy jen velmi malý podíl všech fluoroforů, jejichž fluorescence se snímá, dokud nedojde k jejich vybělení. Poté se převede do stavu schopného fluorescence další malá část fluoroforů a snímají se, dokud se nevybělí. Tento postup se opakuje, dokud není nasnímáno dostatečné množství fluoroforů. Fotony nasnímané z jednoho fluoroforu jsou detekovány na širším prostoru podle rozptylové funkce (PSF, point spread function). Poté se matematicky určí střed PSF a danému fluoroforu se přiřadí tato spočítaná souřadnice. Čím více fotonů se detekuje z daného fluoroforu, tím lépe je definovaná PSF a tím přesnější je lokalizace fluoroforu. Lze dosáhnout rozlišení až v jednotkách nm. Jako fluorofory se využívají buď fotoaktivovatelné fluorescenční proteiny (např. PA-GFP) [13][14], nebo organické fluorescenční barvy (např. Cy5 spojená s Cy3) [12]. K aktivaci fluoroforu obvykle dochází osvícením laserem s nízkou intenzitou, využívající jinou barvu, než se poté využívá k vybuzení fluorescence. Nevýhodou těchto metod je obvykle delší doba snímání celkového obrazu, protože se musí nasnímat velké množství dílčích obrazů.
- Superrozlišovací mikroskopie


Reference
- ↑ Manuel Gunkel, Fabian Erdel, Karsten Rippe, Paul Lemmer, Rainer Kaufmann, Christoph Hörmann, Roman Amberger and Christoph Cremer: Dual color localization microscopy of cellular nanostructures. In: Biotechnology Journal, 2009, 4, 927-938. ISSN 1860-6768
- ↑ REYMANN, J; BADDELEY, D; GUNKEL, M; LEMMER, P; STADTER, W; JEGOU, T; RIPPE, K. High-precision structural analysis of subnuclear complexes in fixed and live cells via spatially modulated illumination (SMI) microscopy. Chromosome research : an international journal on the molecular, supramolecular and evolutionary aspects of chromosome biology. May 2008, s. 367–82. DOI 10.1007/s10577-008-1238-2. PMID 18461478.
- ↑ C. Cremer, R.Kaufmann, M. Gunkel, F. Polanski, P. Müller, R. Dierkes, S. Degenhard, C. Wege, M. Hausmann, U. Birk:"Application perspectives of localization microscopy in virology", Histochem Cell Biol (2014)
- ↑ Qiaoyun Wang, Rüdiger Dierkes, Rainer Kaufmanna, Christoph Cremer:"Quantitative analysis of individual hepatocyte growth factor receptor clusters in influenza A virus infected human epithelial cells using localization microscopy" Biochimica et Biophysica Acta (2014)
- ↑ Microscope work wins Nobel Prize. www.bbc.com. BBC, 8 October 2014. Dostupné online.
- ↑ CREMER, C.; CREMER, T. Considerations on a laser-scanning-microscope with high resolution and depth of field. Microscopia Acta. 1978, čís. 1, s. 31–44. Dostupné v archivu pořízeném dne 2016-03-04. Archivováno 4. 3. 2016 na Wayback Machine.
- ↑ HELL, S.W., et al. Confocal microscopy with an increased detection aperture: type-B 4Pi confocal microscopy. Optics Letters. 1994, čís. 3, s. 222–224. Dostupné online. DOI 10.1364/OL.19.000222.
- ↑ GUSTAFSSON, M.G. Surpassing the lateral resolution limit by a factor of two using structured illumination microscopy. Journal of Microscopy. 2000, čís. 2, s. 82–87. DOI 10.1046/j.1365-2818.2000.00710.x.
- ↑ GUSTAFSSON, M.G. Nonlinear structured-illumination microscopy: Wide-field fluorescence imaging with theoretically unlimited resolution. PNAS. 2005, čís. 37, s. 13081–6. DOI 10.1073/pnas.0406877102.
- ↑ Cummings JR, Fellers TJ, Davidson MW. Specialized Microscopy Techniques - Near-Field Scanning Optical Microscopy [online]. 2007 [cit. 2007-08-22]. Dostupné v archivu pořízeném dne 2007-03-14.
- ↑ HUANG, Bo; BATES, M.; ZHUANG, X. Super resolution fluorescence microscopy. Annual Review of Biochemistry. 2009, s. 993–1016. DOI 10.1146/annurev.biochem.77.061906.092014.
- ↑ a b RUST, M.; BATES, M.; ZHUANG, X. Sub-diffraction-limit imaging by stochastic optical reconstruction microscopy (STORM). Nature Methods. 2006, čís. 10, s. 793–796. DOI 10.1038/nmeth929.
- ↑ a b BETZIG, E., et al. Imaging Intracellular Fluorescent Proteins at Nanometer Resolution. Science. 2006, čís. 5793, s. 1642–1645. DOI 10.1126/science.1127344.
- ↑ a b HESS, S.; GIRIRIJAN, T.; MASON, M. Ultra-High Resolution Imaging by Fluorescence Photoactivation Localization Microscopy. Biophysical Journal. 2006, čís. 11, s. 4258–4272. DOI doi=10.1529/biophysj.106.091116.
Média použitá na této stránce

Autor: Andy Nestl, Licence: CC BY-SA 3.0
Localisation microscopy: SPDMphymod images of Tobacco mosaic virus (TMV) particles with coated proteins labeled with the fluorophore Atto448.
B: after Gaussian blurring corresponding to the individual localization accuracy D: same data, but distribution of the individual molecule position without Gaussain blurring
Virus Super Resolution Microscopy/Optical nanoscopy: A further example for the use of localization microscopy/SPDM is an analysis of Tobacco mosaic virus (TMV) particles. TMV particles are not only important in plant research but are also an example for a class of most promising biomolecule complexes exhibiting a high potential for nanotechnology applications as virus-derived biotemplates for nanostructured hybrid materials and building-blocks in analytical, technical & therapeutic applications.
Collaboration of the former Christoph Cremer lab, emeritus at Heidelberg university [1], [2] & the Wege lab (Universities of Stuttgart).
Reference: Superresolution imaging of biological nanostructures by spectral precision distance microscopy (2011): Cremer, R. Kaufmann, M. Gunkel, S. Pres, Y. Weiland, P- Müller, T. Ruckelshausen, P. Lemmer, F. Geiger, S. Degenhard, C. Wege, N- A. W. Lemmermann, R. Holtappels, H. Strickfaden, M. Hausmann , Biotechnology 6: 1037–1051
Autor: Andy Nestl, Licence: CC BY-SA 3.0
First description of 50 nm optical resolution of cellular structures in label-free cells:
Interestingly SPDM revealed cellular objects not detectable under conventional light microscopy
Christoph Cremer, emeritus at Heidelberg university [1]
Comprehensive studies published in Micron, 2010: The paper describes for the first time that optical resolution of cellular structures in the lamda/10 range (about 50 nm) can be achieved even in label-free cells using the localization microscopy SPDM (Spectral Precision Distance/Position Determination Microscopy).
Beside a substantial resolution improvement of autofluorescent structures, SPDM revealed cellular objects with are not detectable under conventional fluorescence imaging conditions.
Rainer Kaufmann, Patrick Müller, Michael Hausmann, Christoph Cremer: Imaging label-free intracellular structures by localisation microscopy. Micron (2010), doi:10.1016/j.micron.2010.03.06
Autor: Andy Nestl, Licence: CC BY-SA 3.0
Superresolution Microscopy/ Optical nanoscopy using SPDMphymod as a new localization microscopy technique for standard fluorescent dyes
SPDMphymod image of protein distribution in a human cancer cell. Enlarged inserts above and below: Positions of single fluorescent molecules in Gaussian intensity shape of 5 nm standard deviation. Typical distance measurements in the 15 nm range are highlighted
Fundamental to SPDMphymod are blinking phenomena (flashes of fluorescence), induced by reversible bleaches (metastable dark states). Individual molecules of the same spectral emission color can be detected. Counting individual molecules up to a density of 1000/µm2 – at present, this is possible in an area of up to 5000 µm2.
Christoph Cremer, emeritus at Heidelberg university [1] Basic publications:
Lemmer P, Gunkel M, Baddeley D, Kaufmann R, Urich A, Weiland Y, Reymann J, Müller P, Hausmann M, Cremer C: SPDM – Light Microscopy with Single Molecule Resolution at the Nanoscale. In: Applied Physics B 2008; 93: 1–12
Manuel Gunkel, Fabian Erdel, Karsten Rippe, Paul Lemmer, Rainer Kaufmann, Christoph Hörmann, Roman Amberger and Christoph Cremer: Dual color localization microscopy of cellular nanostructures. In: Biotechnology Journal, 2009, 4, 927-938. ISSN 1860-6768
Autor: Andy Nestl, Licence: CC BY-SA 3.0
Investigation of AMD, macular degeneration a medical condition which usually affects older adults and results in a loss of vision in the center of the visual field (the macula) because of damage to the retina macular degeneration.
Sections from human eye tissue were analyzed with Structured Illumination Microscopy (SMI) / Optical nanoscopy using a specially designed Super Resolution Microscope setup: LSI-TIRF as a total internal reflection interferometer with laterally structured illumination. This SMI technique allowed to acquire light-optical images of autofluorophore distributions in the tissue with previously unmatched optical resolution. Use of three different excitation wavelengths (488, 568 and 647 nm), enables to gather spectral information about the autofluorescence signal.
Detailed Image description: Overview image. The SMI image (right) shows more details and less out of focus light than the widefield image (left). The Bruch membrane (B) is located between the choroid (C) and the retinal pigment epithelium (RPE). On the top of the image endings of retinal rod cells (R) can be seen. The scale bar is 2�m.
Reference: Best G, Amberger R, Baddeley D, Ach T, Dithmar S, Heintzmann R and Cremer C (2011). Structured illumination microscopy of autofluorescent aggregations in human tissue. Micron, 42, 330-335.
Autor: Andy Nestl, Licence: CC BY-SA 3.0
GFP superresolution, optical nanoscopy ( Christoph Cremer, emeritus at Heidelberg university [1])
View of a nucleus of a bone cancer cell: using normal high resolution fluorescence microscopy, it is not possible to distinguish details of its structure (image on the left). Using the two Color Localization Microscopy 2CLM (image on the right) it is possible to localize 70,000 histone molecules (red: RFP-H2A) and 50,000 chromatin remodeling proteins (green: GPF-Snf2H) in a field of view of 470 µm2 with an optical depth of 600 nm. Common fluorescence markers were used.
2CLM is the only optical nanoscopy method that allows position based co-localization of single molecules at high density in a wide field of view using conventional fluorescent proteins such as GFP, YFP, RFP, or other conventional fluorochromes.
Due to its high optical single molecule resolution, 2CLM allows significantly more precise analyses of potential protein interactions than FRET-(Fluorescence Resonance Energy Transfer) technology, which is at present the preferred method for such investigations. This is of particular significance in studies of biomolecular machines (BMMs) within cells: Single BMMS can be analysed, including the number of molecules of a given type; distances between proteins in these BMMs often are substantially greater than those that can be analyzed by FRET (restricted to a maximum distance of only a few nm).
Possible to use conventional, well established and inexpensive fluorescent dyes, from the GFP group, and its dye variants, to the well-known Alexa and fluorescein dyes. Fundamental to SPDMphymod are blinking phenomena (flashes of fluorescence), induced by reversible bleaches (metastable dark states). Individual molecules of the same spectral emission color can be detected.
Publikation: Manuel Gunkel, Fabian Erdel, Karsten Rippe, Paul Lemmer, Rainer Kaufmann, Christoph Hörmann, Roman Amberger and Christoph Cremer: Dual color localization microscopy of cellular nanostructures. In: Biotechnology Journal, 2009, 4, 927-938. ISSN 1860-6768
Autor: Andy Nestl, Licence: CC BY-SA 3.0
3D Dual Color Super Resolution Microscopy by combining localization microscopy SPDM with spatially modulated illumination SMI / Optical nanoscopy / Christoph Cremer emeritus at Heidelberg university [1], [2]
3D reconstruction of dual color acquistion of Her2/neu and Her 3. A) conventional wide-field fluorescence image of an AG11132 mammary epithelial cells. Her3 is labelled with Alexa488 (green) and Her2/neu with Alexa568 (red). B) magnified image of a small area of A. C) localization microscopy SPDM of the same region of interest as in B. D) and E) show a 3D reconstruction of the protein clusters using the combination of SPDM and SMI microscopy (LIMON technology). Scale bars in D) and E) are 500 nm in each direction.
By combining SPDMphymod with SMI (both invented in Christoph Cremer´s lab in 1996) a 3D dual colour reconstruction of the spatial arrangements of Her2/neu and Her3 clusters was achieved. The positions in all three directions of the protein clusters could be determined with an accuracy of about 25 nm.
Her2/neu and Her3 are tyrosine kinase receptors and their overexpression is related to certain types breast cancer. The paper analyses the Her2 distribution pattern in breast cancer cells and counts the clusters (20 637 clusters with a mean diameter of 67 nm) with a specifically developed clusters finding algorithm for super resolution microscopy. This methods could help for the exploration of the resistance mechanism in Trastuzumab/Herceptin treatment.
Publication: Rainer Kaufmann, Patrick Müller, Georg Hildenbrand, Michael Hausmann & Christoph Cremer [3], [4] : Analysis of Her2/neu membrane protein clusters in different types of breast cancer cells using localization microscopy, Journal of Microscopy 2010, doi: 10.1111/j.1365-2818.2010.03436.xAutor: Changes in layout by the uploader. Only the creator of the original (Lothar Schermelleh) should be credited., Licence: CC BY-SA 3.0
Comparison of the resolution obtained by confocal laser scanning microscopy (top) and 3D structured illumination microscopy (3D-SIM-Microscopy, bottom). Shown are details of a nuclear envelope. Nuclear pores (anti-NPC) red, nuclear envelope (anti-Lamin) green, chromatin (DAPI-staining) blue. Scale bars: 1µm. For further information see: Schermelleh L, Carlton PM, Haase S, Shao L, Winoto L, Kner P, Burke B, Cardoso MC, Agard DA, Gustafsson MG, Leonhardt H, Sedat JW (June 2008). "Subdiffraction multicolor imaging of the nuclear periphery with 3D structured illumination microscopy". Science (journal) 320 (5881): 1332–6. DOI:10.1126/science.1156947. PMID 18535242.