Nightingale-mortality
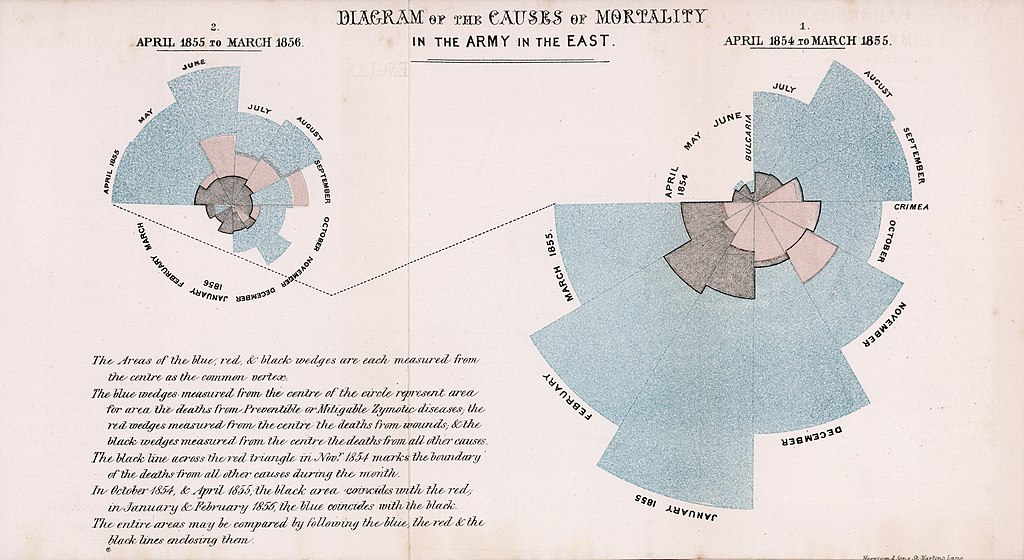
Example of polar area diagram by Florence Nightingale (1820–1910).
This "Diagram of the causes of mortality in the army in the East" was published in Notes on Matters Affecting the Health, Efficiency, and Hospital Administration of the British Army and sent to Queen Victoria in 1858.
This graphic indicates the annual rate of mortality per 1,000 in each month that occurred from preventable diseases (in blue), those that were the results of wounds (in red), and those due to other causes (in black).
The legend reads:
The Areas of the blue, red, & black wedges are each measured from the centre as the common vertex.
The blue wedges measured from the centre of the circle represent area for area the deaths from Preventable or Mitigable Zymotic diseases, the red wedges measured from the centre the deaths from wounds, & the black wedges measured from the centre the deaths from all other causes.
The black line across the red triangle in Nov. 1854 marks the boundary of the deaths from all other causes during the month.
In October 1854, & April 1855, the black area coincides with the red, in January & February 1856, the blue coincides with the black.
The entire areas may be compared by following the blue, the red, & the black lines enclosing them.
Relevantní obrázky
Relevantní články
Florence NightingalováFlorence Nightingalová byla anglická ošetřovatelka, autorka odborné literatury a průkopnice srovnávací lékařské statistiky. Pomohla snížit úmrtnost pacientů v nemocnicích řady zemí a založila první zdravotnickou školu pro dívky. Je pokládána za zakladatelku ošetřovatelství jako vědy. Ovlivnila zdravotní péči 19. a 20. století v celém světě. .. pokračovat ve čtení
Kruhový diagramKruhový diagram nebo také graf je způsob strukturovaného grafického znázornění vztahů matematických nebo statistických dat. V kruhovém grafu je délka oblouku každého řezu úměrná množství, které představuje. Pro svou podobu s koláčem se někdy hovoří o koláčovém grafu. Existují různé varianty, jak může být prezentován. Plocha kruhu představuje celý objem souboru (dat). Jeho jednotlivé části (výseče) zobrazují podíl dílčích hodnot na celkovém objemu dat. Obvykle jsou jednotlivé výseče odlišeny barvou. .. pokračovat ve čtení


