Uranium production world
(c) Anwar saadat na projektu Wikipedie v jazyce angličtina, CC BY-SA 3.0
Autor:
Anwar saadat na projektu Wikipedie v jazyce angličtina
Shortlink:
Zdroj:
Formát:
1425 x 625 Pixel (60286 Bytes)
Popis:
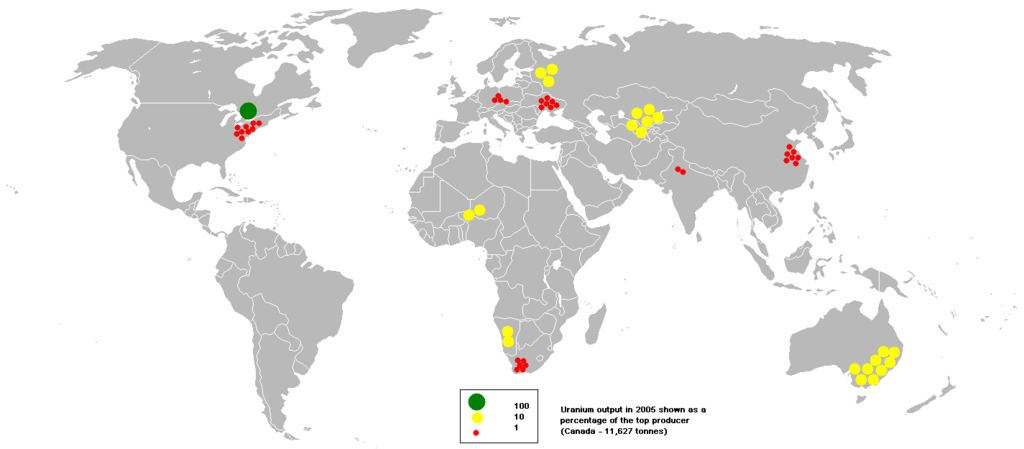
This bubble map shows the global distribution of uranium output in 2005 as a percentage of the top producer (Canada - 11,627 tonnes).
This map is consistent with incomplete set of data too as long as the top producer is known. It resolves the accessibility issues faced by colour-coded maps that may not be properly rendered in old computer screens.
Data was extracted on 29th May 2007. Source - http://www.bgs.ac.uk/mineralsuk/free_downloads/home.html#WMP
Based on en:Image:BlankMap-World.png
Licence:
Credit:
Relevantní obrázky
Relevantní články
Seznam států světa podle těžby uranuTento seznam řadí státy světa podle objemů těžby uranu. .. pokračovat ve čtení
