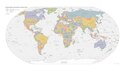
CO2 responsibility 1950-2000

Data from the World Resources Institute's CAIT 4.0 database (registration required). Includes CO2 emitted up to the year 2000 only (not CH4, N20, PFCs, HFCs or SF6). Estimates of the effects of land-use change are included; bunker-fuel emissions are not. The scale is a 0-100 decay-weighted index.
The land-use estimates include the following (list from the relevant CAIT data note):
- Clearing of natural ecosystems for permanent croplands (cultivation)
- Clearing of natural ecosystems for permanent pastures (no cultivation)
- Abandonment of croplands and pastures with subsequent recovery of carbon stocks to
those of the original ecosystem
- Shifting cultivation (swidden agriculture) (repeated clearing, abandonment, and reclearing
of forests in many tropical regions)
- Wood harvest (industrial wood as well as fuel wood) - it is important to note that these
estimates include the emissions of carbon from wood products (burned, stored in longterm pools, decayed over time)
- For the U.S. only, management of wildfires and woody encroachment
Also from the CAIT data note: "It is also important to note that the calculated flux of carbon does not explicitly include changes in carbon stocks that may result from various forms of management. Examples of what is not included are agricultural intensification, fertilization, the trend to no-till agriculture, thinning of forests, changes in species or varieties, and other silvicultural practices."
And the data note warns that "these estimates of national sources and sinks of carbon from land-use change are uncertain on the order of +/- 150% for large fluxes, and +/- 50 MtC/yr for estimates near zero."
So CAIT's land-use estimates are a bit wild. They are, however, the best currently available at a national level.


Relevantní obrázky


Relevantní články
Mapa světaMapa světa je mapa většiny nebo celého povrchu Země. Mapy světa tvoří zvláštní kategorii map vzhledem k problému projekce. Rovinné mapy nutně zkreslují prezentaci zakřiveného zemského povrchu. Tyto deformace jsou na mapě světa největší. Různé druhy projekcí povrchu země odrážejí různé technické a estetické požadavky na mapy světa. .. pokračovat ve čtení