Gamma plot
Autor:
Přisuzování:
Obrázek je označen jako „Vyžadováno uvedení zdroje“ (Attribution Required), ale nebyly uvedeny žádné informace o přiřazení. Při použití šablony MediaWiki pro licence CC-BY byl pravděpodobně parametr atribuce vynechán. Autoři zde mohou najít příklad pro správné použití šablon.
Shortlink:
Zdroj:
Formát:
600 x 480 Pixel (13205 Bytes)
Popis:
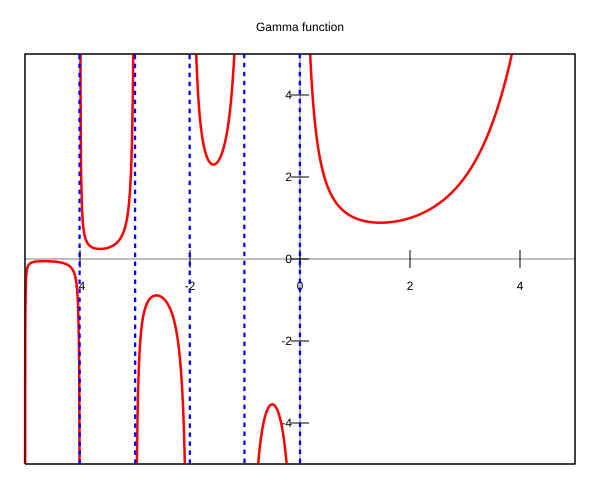
Plot of the Gamma function . The plot was produced running Gnuplot on the following code:
set terminal svg
set output "Gamma_plot.svg"
set title "Gamma function"
set xrange [-10:10]
set yrange [-10:10]
set key off
set xzeroaxis linetype -1 linewidth 0.5
set yzeroaxis linetype -1 linewidth 0.5
set xtics axis
set ytics axis
plot "gamma.dat" using 1:2 with lines linewidth 2
the file "gamma.dat" contains the values of the Gamma function and can be produced with the following Matlab commands (it is meant to work in Octave, too, but it returns an error in version 2.1.64):
t = -5:0.01:5;
G = [ t; gamma(t) ];
G = G';
save -ascii "gamma.dat" G;
it was then post-processed with Sodipodi.
Licence:
Credit:
Vlastní dílo (Původní text: „own work“)
Relevantní obrázky
Relevantní články
Gama funkceGama funkce je zobecněním faktoriálu pro obor komplexních čísel. Používá se v mnoha oblastech matematiky, např. pro popis některých rozdělení pravděpodobnosti. .. pokračovat ve čtení


