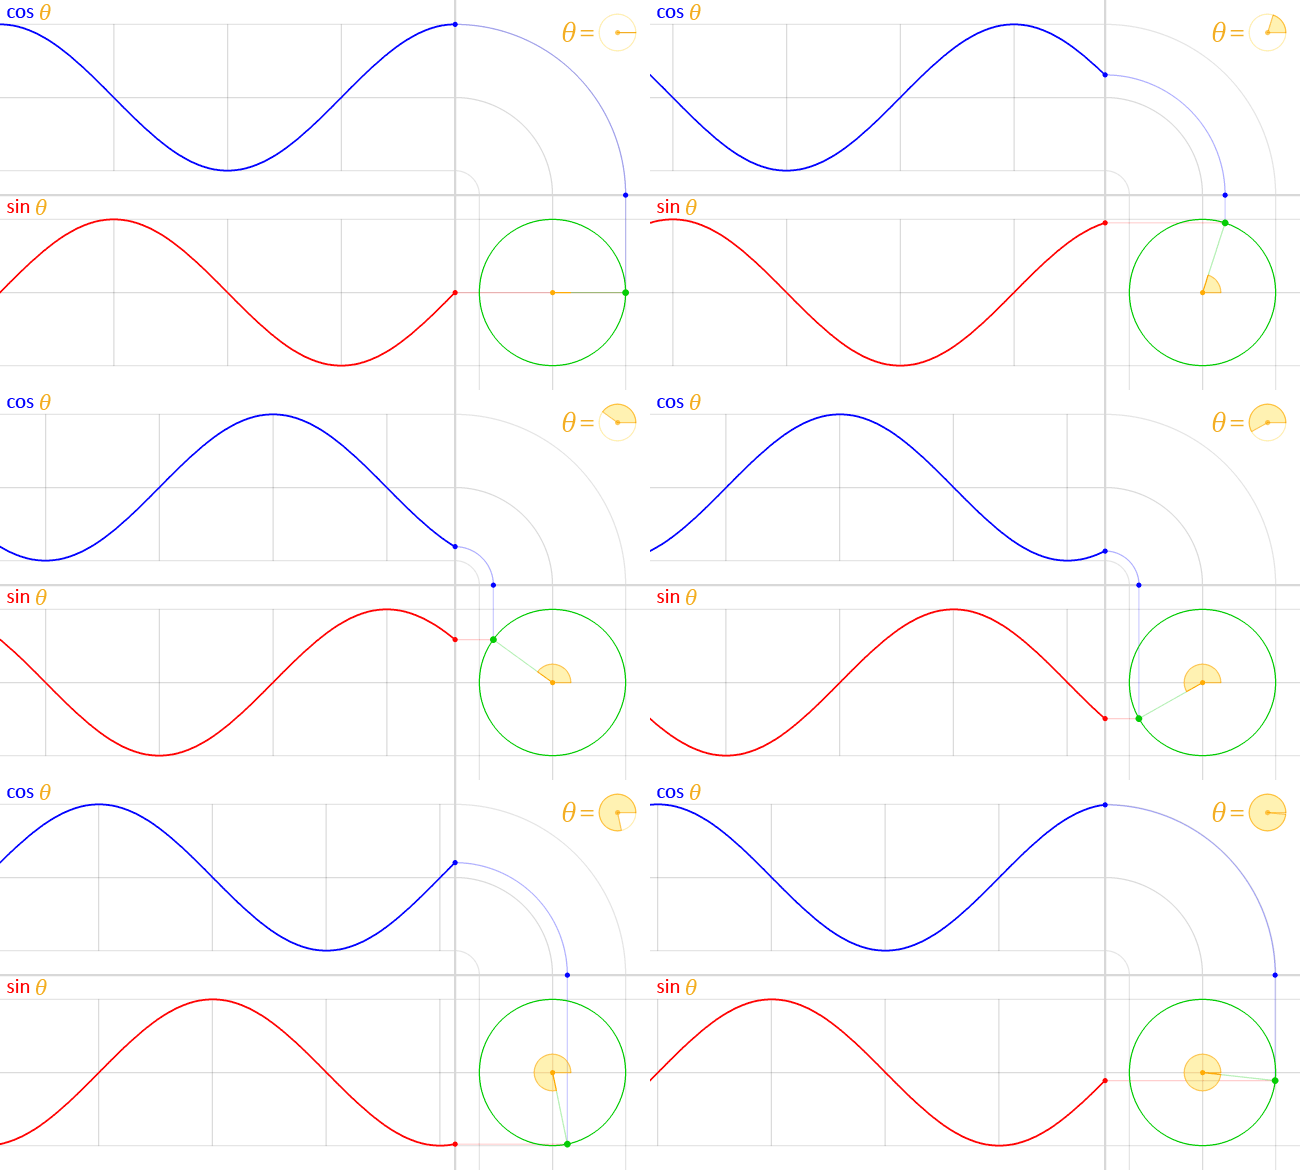
Circle cos sin
In the middle of this circle, in yellow, is represented the angle theta (θ). This angle is the amount of counter-clockwise rotation around the circle starting from the right, on the x-axis, as illustrated. An exact copy of this little angle is shown at the top right, as a visual illustration of the definition of θ.
At this angle, and starting at the origin, a (faint) green line is traced outwards, radially. This line intersects the unit circle at a single point, which is the green point spinning around at a constant rate as the angle θ changes, also at a constant rate.
The vertical position of this point is projected straight (along the faint red line) onto the graph on the left of the circle. This results in the red point. The y-coordinate of this red point (the same as the y-coordinate of the green point) is the value of the sine function evaluated at the angle θ, that is:
- y coordinate of green point = sin θ
As the angle θ changes, the red point moves up and down, tracing the red graph. This is the graph for the sine function. The faint vertical lines seen passing to the left are marking every quadrant along the circle, that is, at every angle of 90° or π/2 radians. Notice how the sine curve goes from 1, to zero, to -1, then back to zero, at exactly these lines. This is reflecting the fact sin(0) = 0, sin(π/2) =1, sin(π) = 0 and sin(3π/ 2) -1
A similar process is done with the x-coordinate of the green point. However, since the x-coordinate is tilted from the usual convention to plot graphs (where y = f(x), with y vertical and x horizontal), an “untilt” operation was performed in order to repeat the process again in the same orientation, instead of vertically. This was represented by a “bend”, seen on the top right.
Again, the green point is projected upwards (along the faint blue line) and this “bent” projection ends up in the top graph’s rightmost edge, at the blue point. The y-coordinate of this blue point (which, due to the “bend” in the projection, is the same as the x-coordinate of the green point) is the value of the cosine function evaluated at the angle θ, that is:
- x coordinate of green point = cos θ
| Já, autor tohoto díla, jej tímto uvolňuji jako volné dílo, a to celosvětově. V některých zemích to není podle zákona možné; v takovém případě: Poskytuji komukoli právo užívat toto dílo za libovolným účelem, a to bezpodmínečně s výjimkou podmínek vyžadovaných zákonem. |
Relevantní obrázky
Relevantní články
Goniometrická funkceJako goniometrické funkce se v matematice nazývá skupina šesti funkcí velikosti úhlu používaných například při zkoumání trojúhelníků a periodických jevů. Goniometrické funkce jsou základem goniometrie. Obvykle se definují jako poměr dvou stran pravoúhlého trojúhelníku nebo délky určitých částí úseček v jednotkové kružnici. Jejich modernější definice je založena na nekonečných řadách nebo řešeních určitých diferenciálních rovnic, díky čemuž je lze vztáhnout také ke komplexním číslům. Inverzní funkce k funkcím goniometrickým se označují jako funkce cyklometrické. .. pokračovat ve čtení
SinusSinus je goniometrická funkce úhlu. Zapisuje se jako sin θ, kde θ je velikost úhlu. Pro ostré úhly je definována v pravoúhlém trojúhelníku jako poměr protilehlé odvěsny a přepony. Definici lze konzistentně rozšířit jak na všechna reálná čísla, tak i do oboru komplexních čísel. .. pokračovat ve čtení


